Address:
601 W. Nedderman Drive, Suite 105
Arlington, TX, 76019-0108
Emissions Inventory
Emissions Inventory Results From 2025

UTA’s total greenhouse gas emissions (GHG) for 2025 amounted to 75,065 metric tons of CO₂e. Despite decreases in Scope 2 emissions (from purchased utilities) over the past three years, Scope 1 emissions (direct emissions from sources owned by the university) continue to increase. The University of Texas at Arlington has continued to experience significant growth, from student enrollment to campus square footage. At the same time, efforts from across the campus to implement actions for increasing sustainability outcomes have continued to be expanded. Overall, the University is seeing benefits from growth in the share of renewables coming from the Texas electric grid. As resiliency increases there, combined with efforts on the campus to implement change, there is the potential for emissions to improve.
Emissions Inventory Results From 2024

Since FY18, UTA has made significant progress in reducing its overall greenhouse gas emissions. Although purchased electricity still accounts for the largest share at 62% of total emissions, Scope 2 emissions have steadily decreased since FY18. The remaining 38% of emissions come from natural gas, refrigerants, stationary gasoline use, and mobile sources.
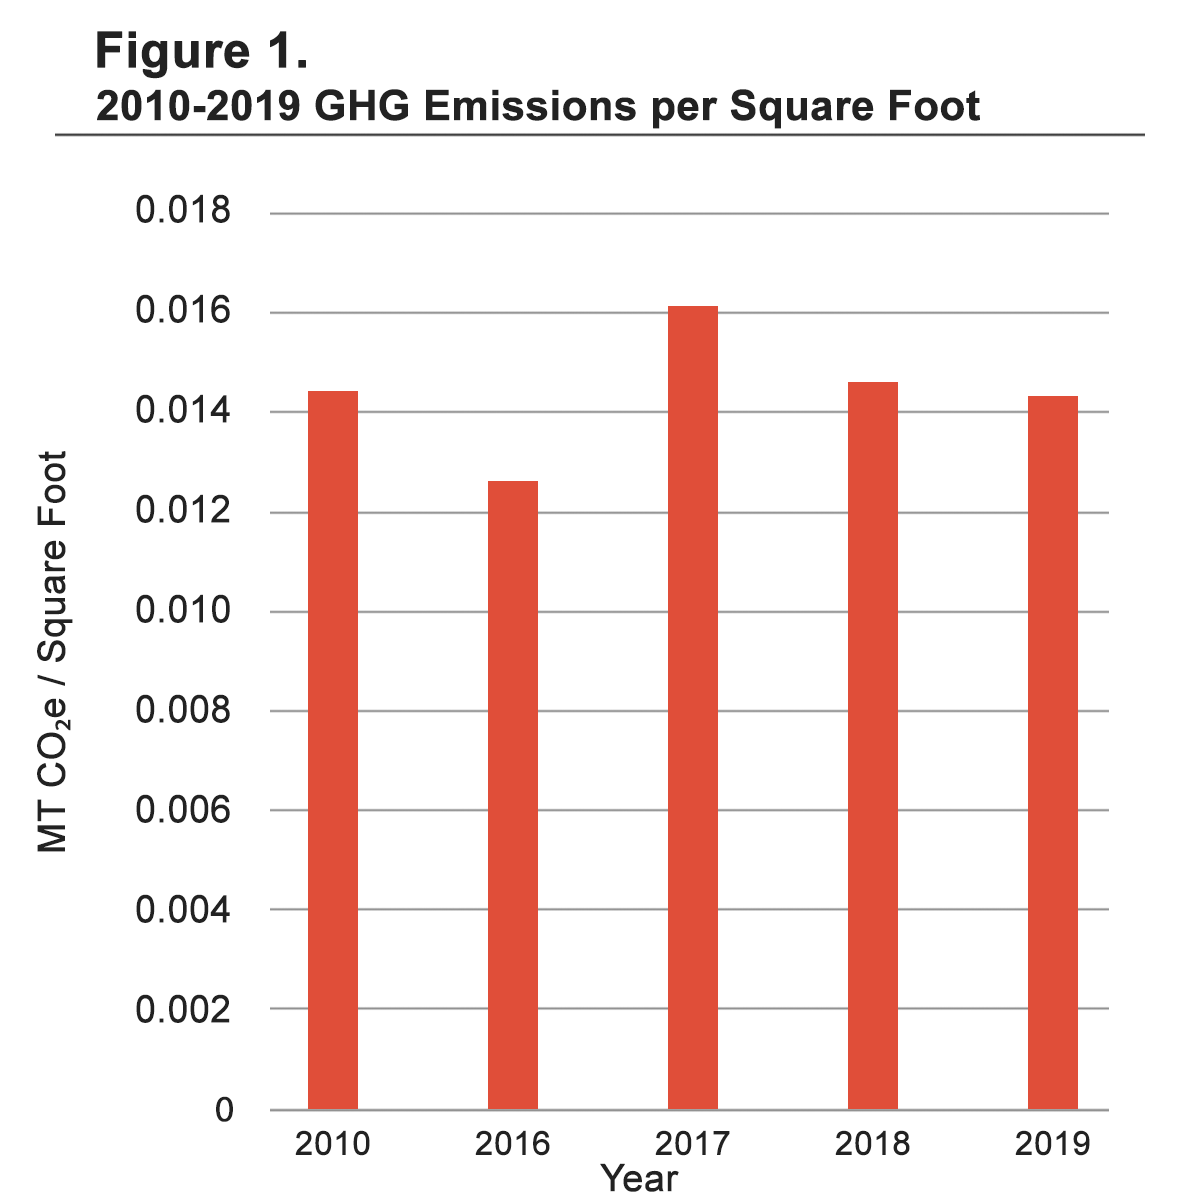
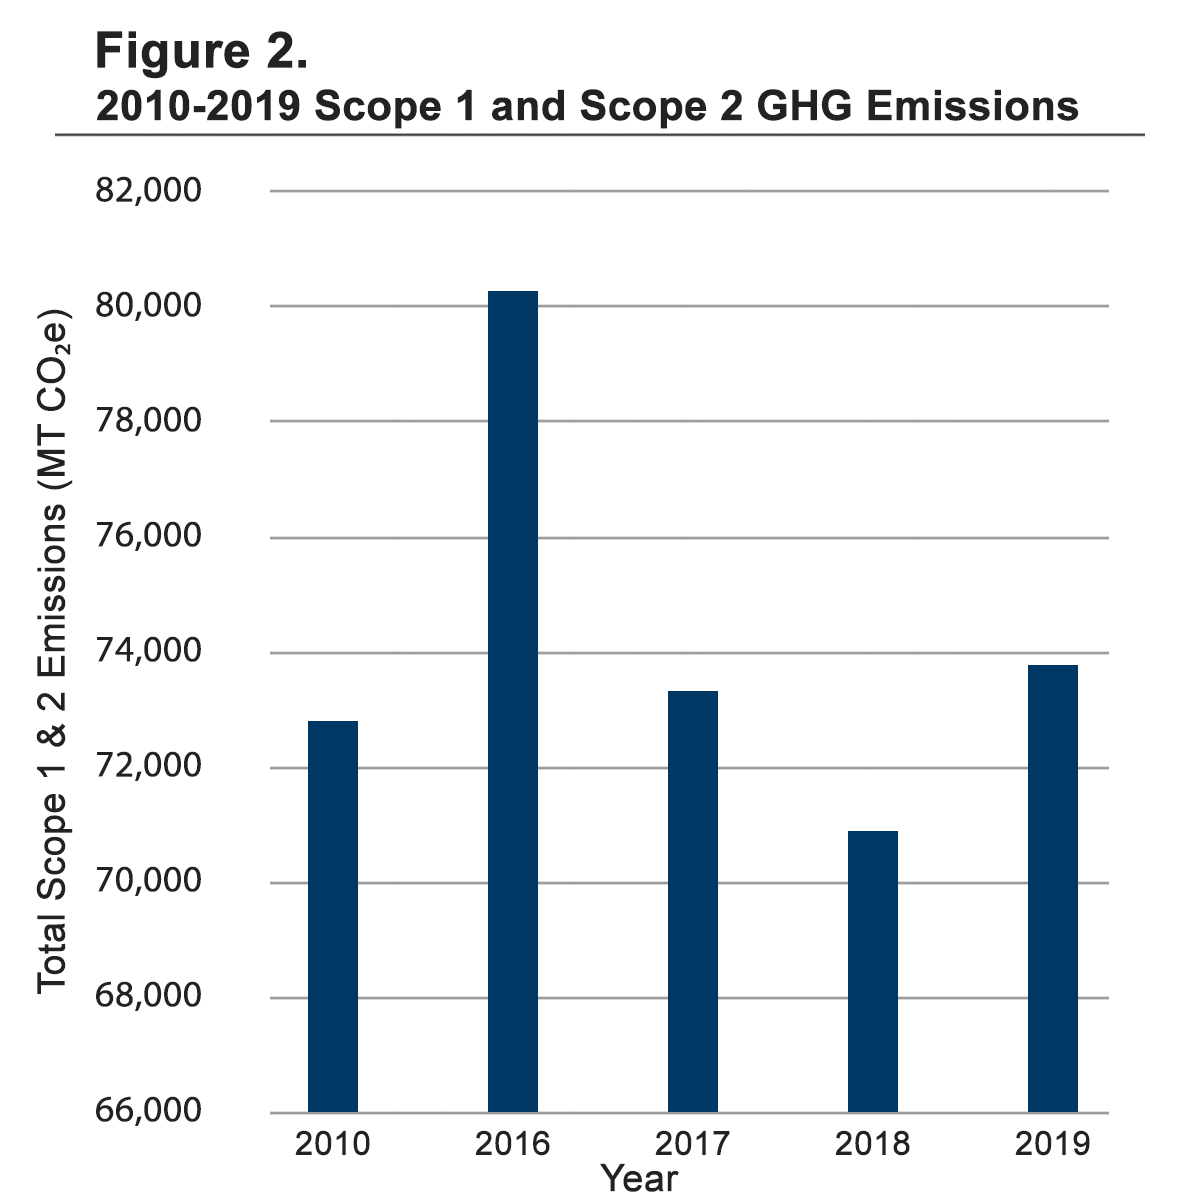
UTA’s campus underwent an expansion in size between 2010 to 2023. Despite this expansion, the greenhouse gas emissions per square foot have been cut by almost a third in this time (see Fig. 4), indicating the success of low emission practices on campus when construction increases are neutralized. However, when looking at total emissions without accounting for the larger size of the campus, there is a net increase from 2010 to 2024 (see Fig. 5). This is a reversal of the previous trend of emissions decreasing below 2010 levels between 2020 and 2022.


Emissions Inventory Results From 2023
UTA's greenhouse gas emissions show that our Scope 1 and Scope 2 emissions have slightly increased since FY22. The slight increase in emissions can be attributed to an increase in the amount of electricity that was bought in FY23. While they are higher this year, they are still lower compared to where they were five years ago.
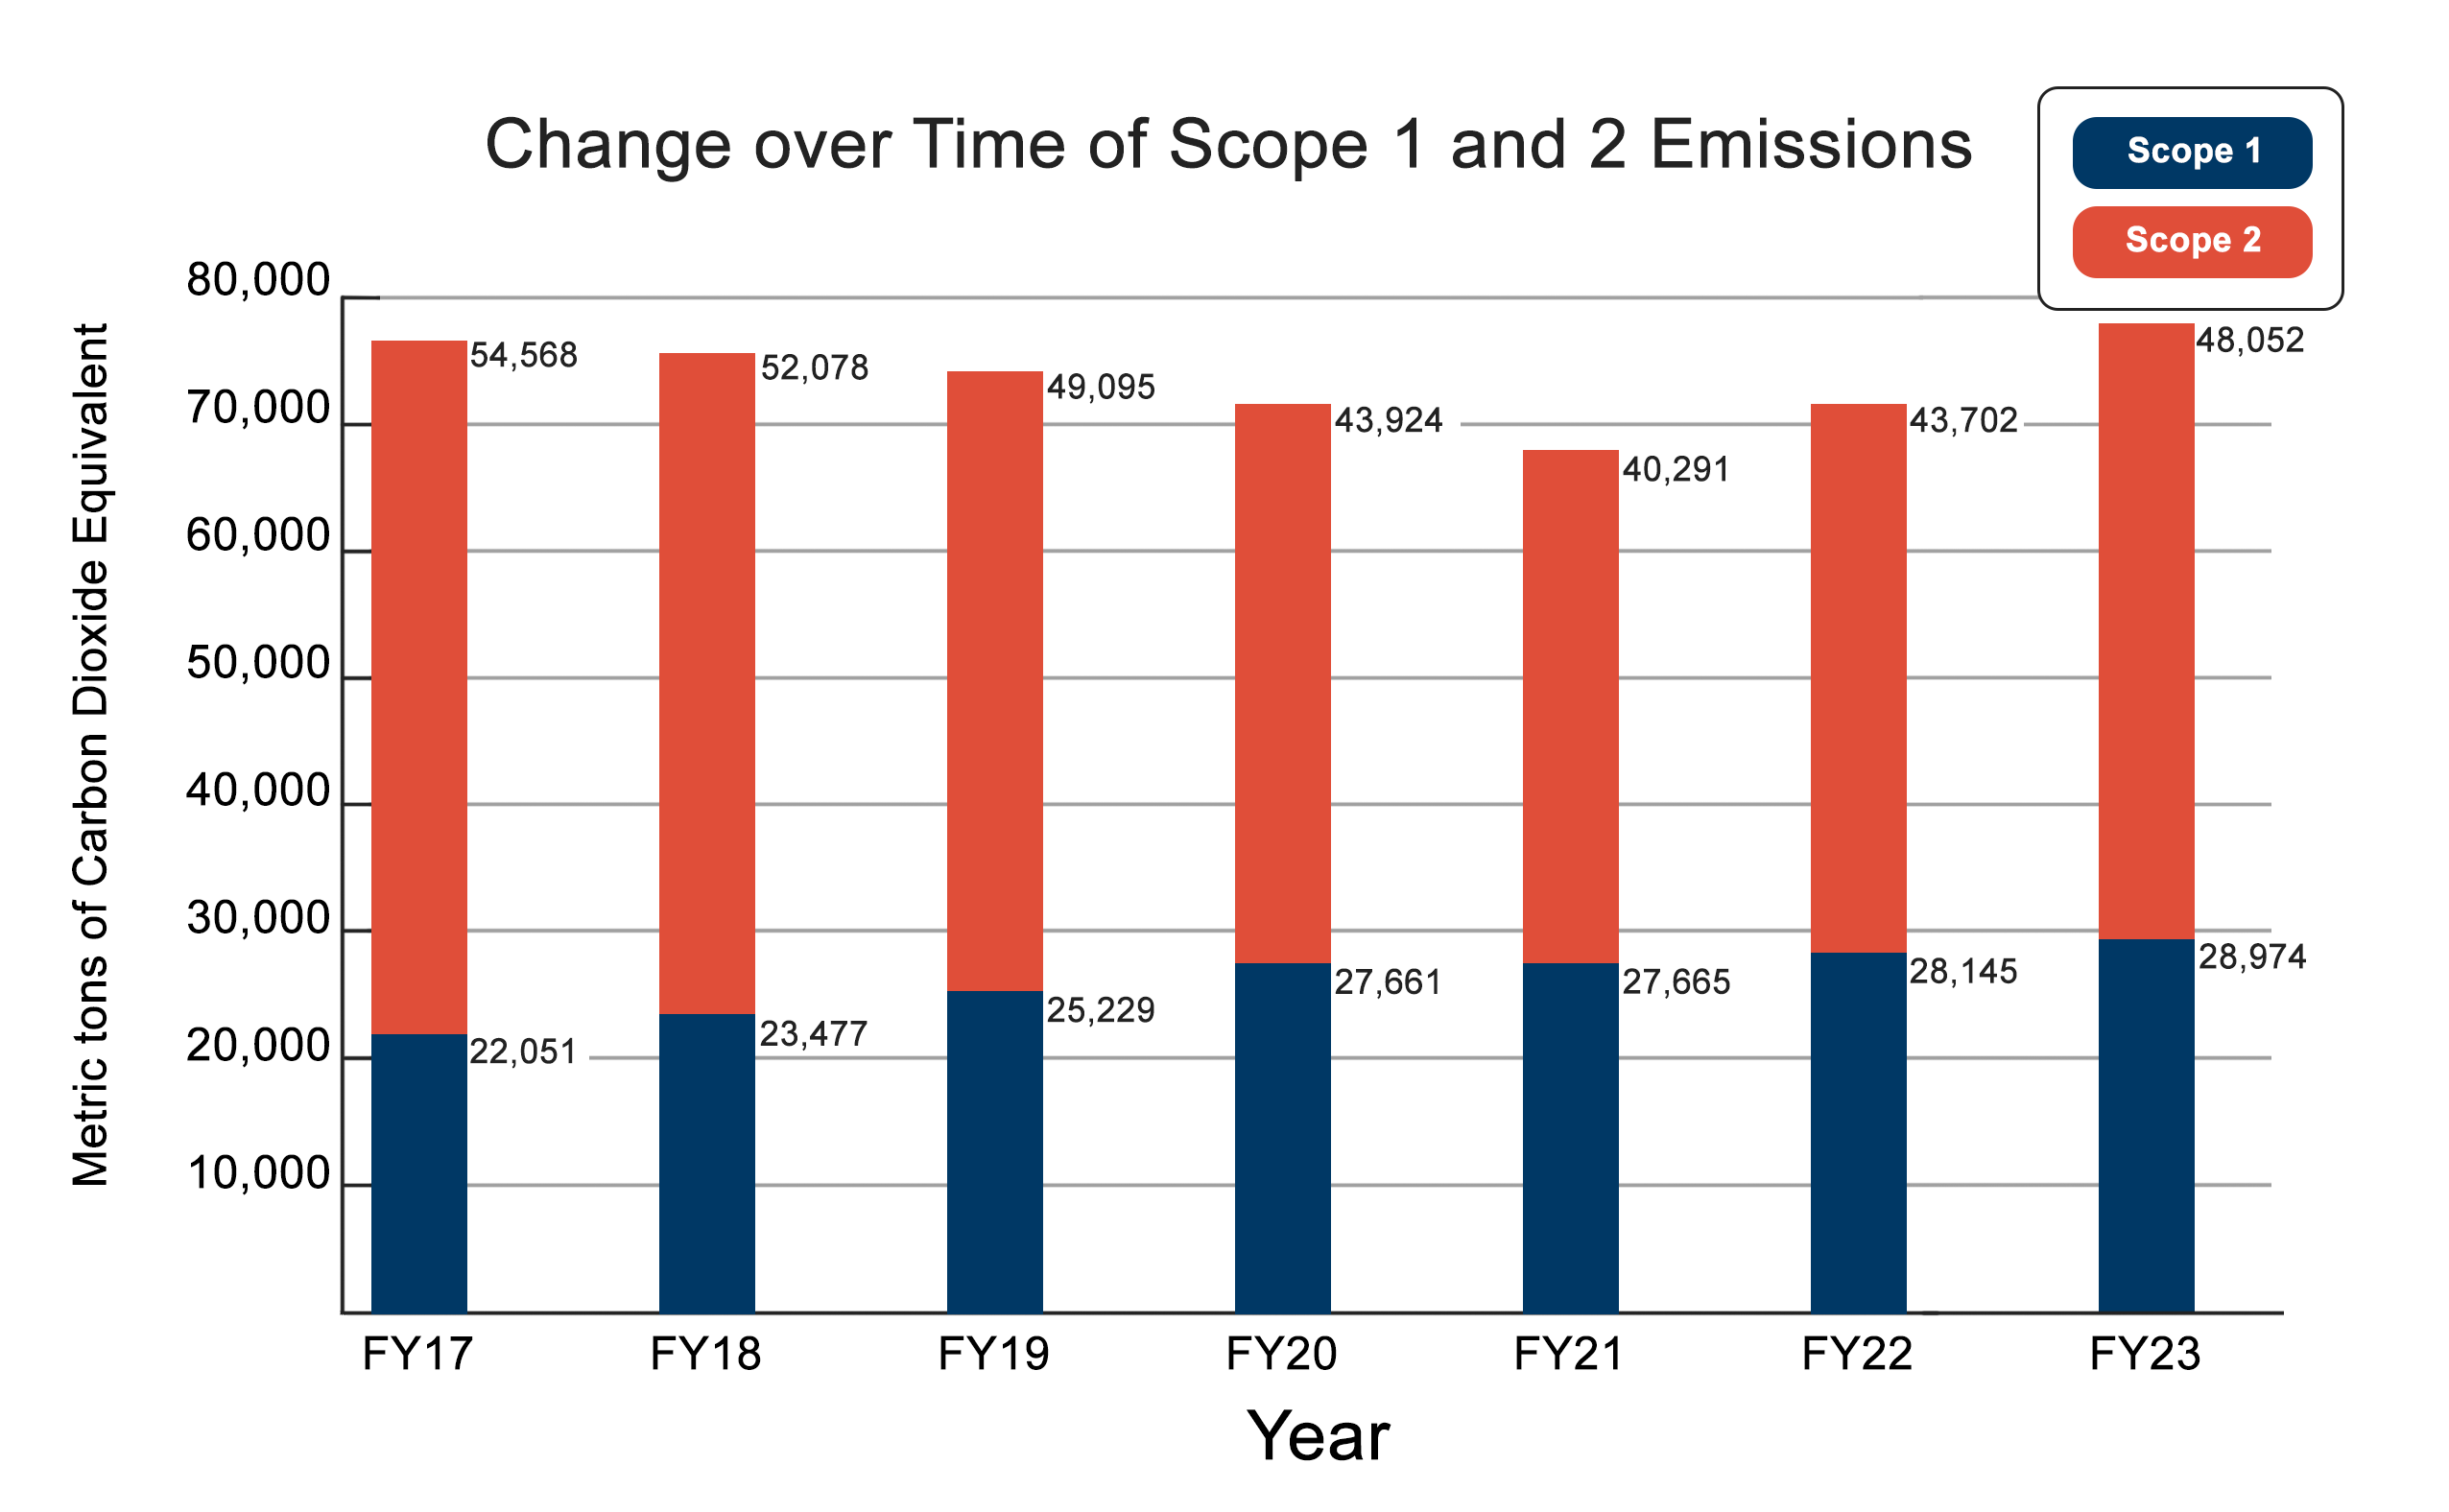
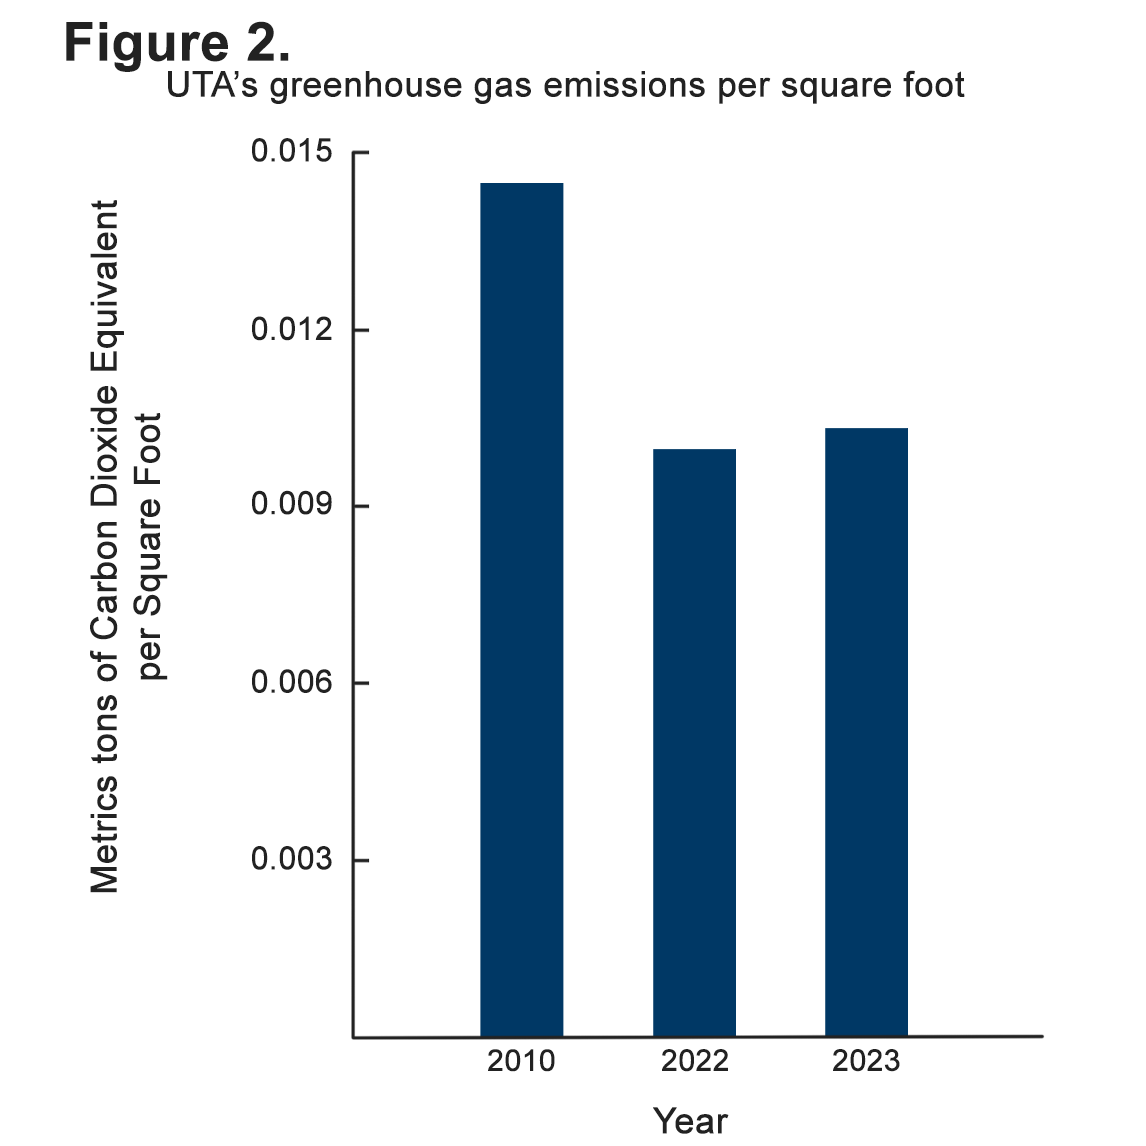
The graph below shows that UTA's GHG emissions per square foot, are slightly higher compared to FY22, but still lower than what they were in 2010.
Emissions Inventory Results From 2022
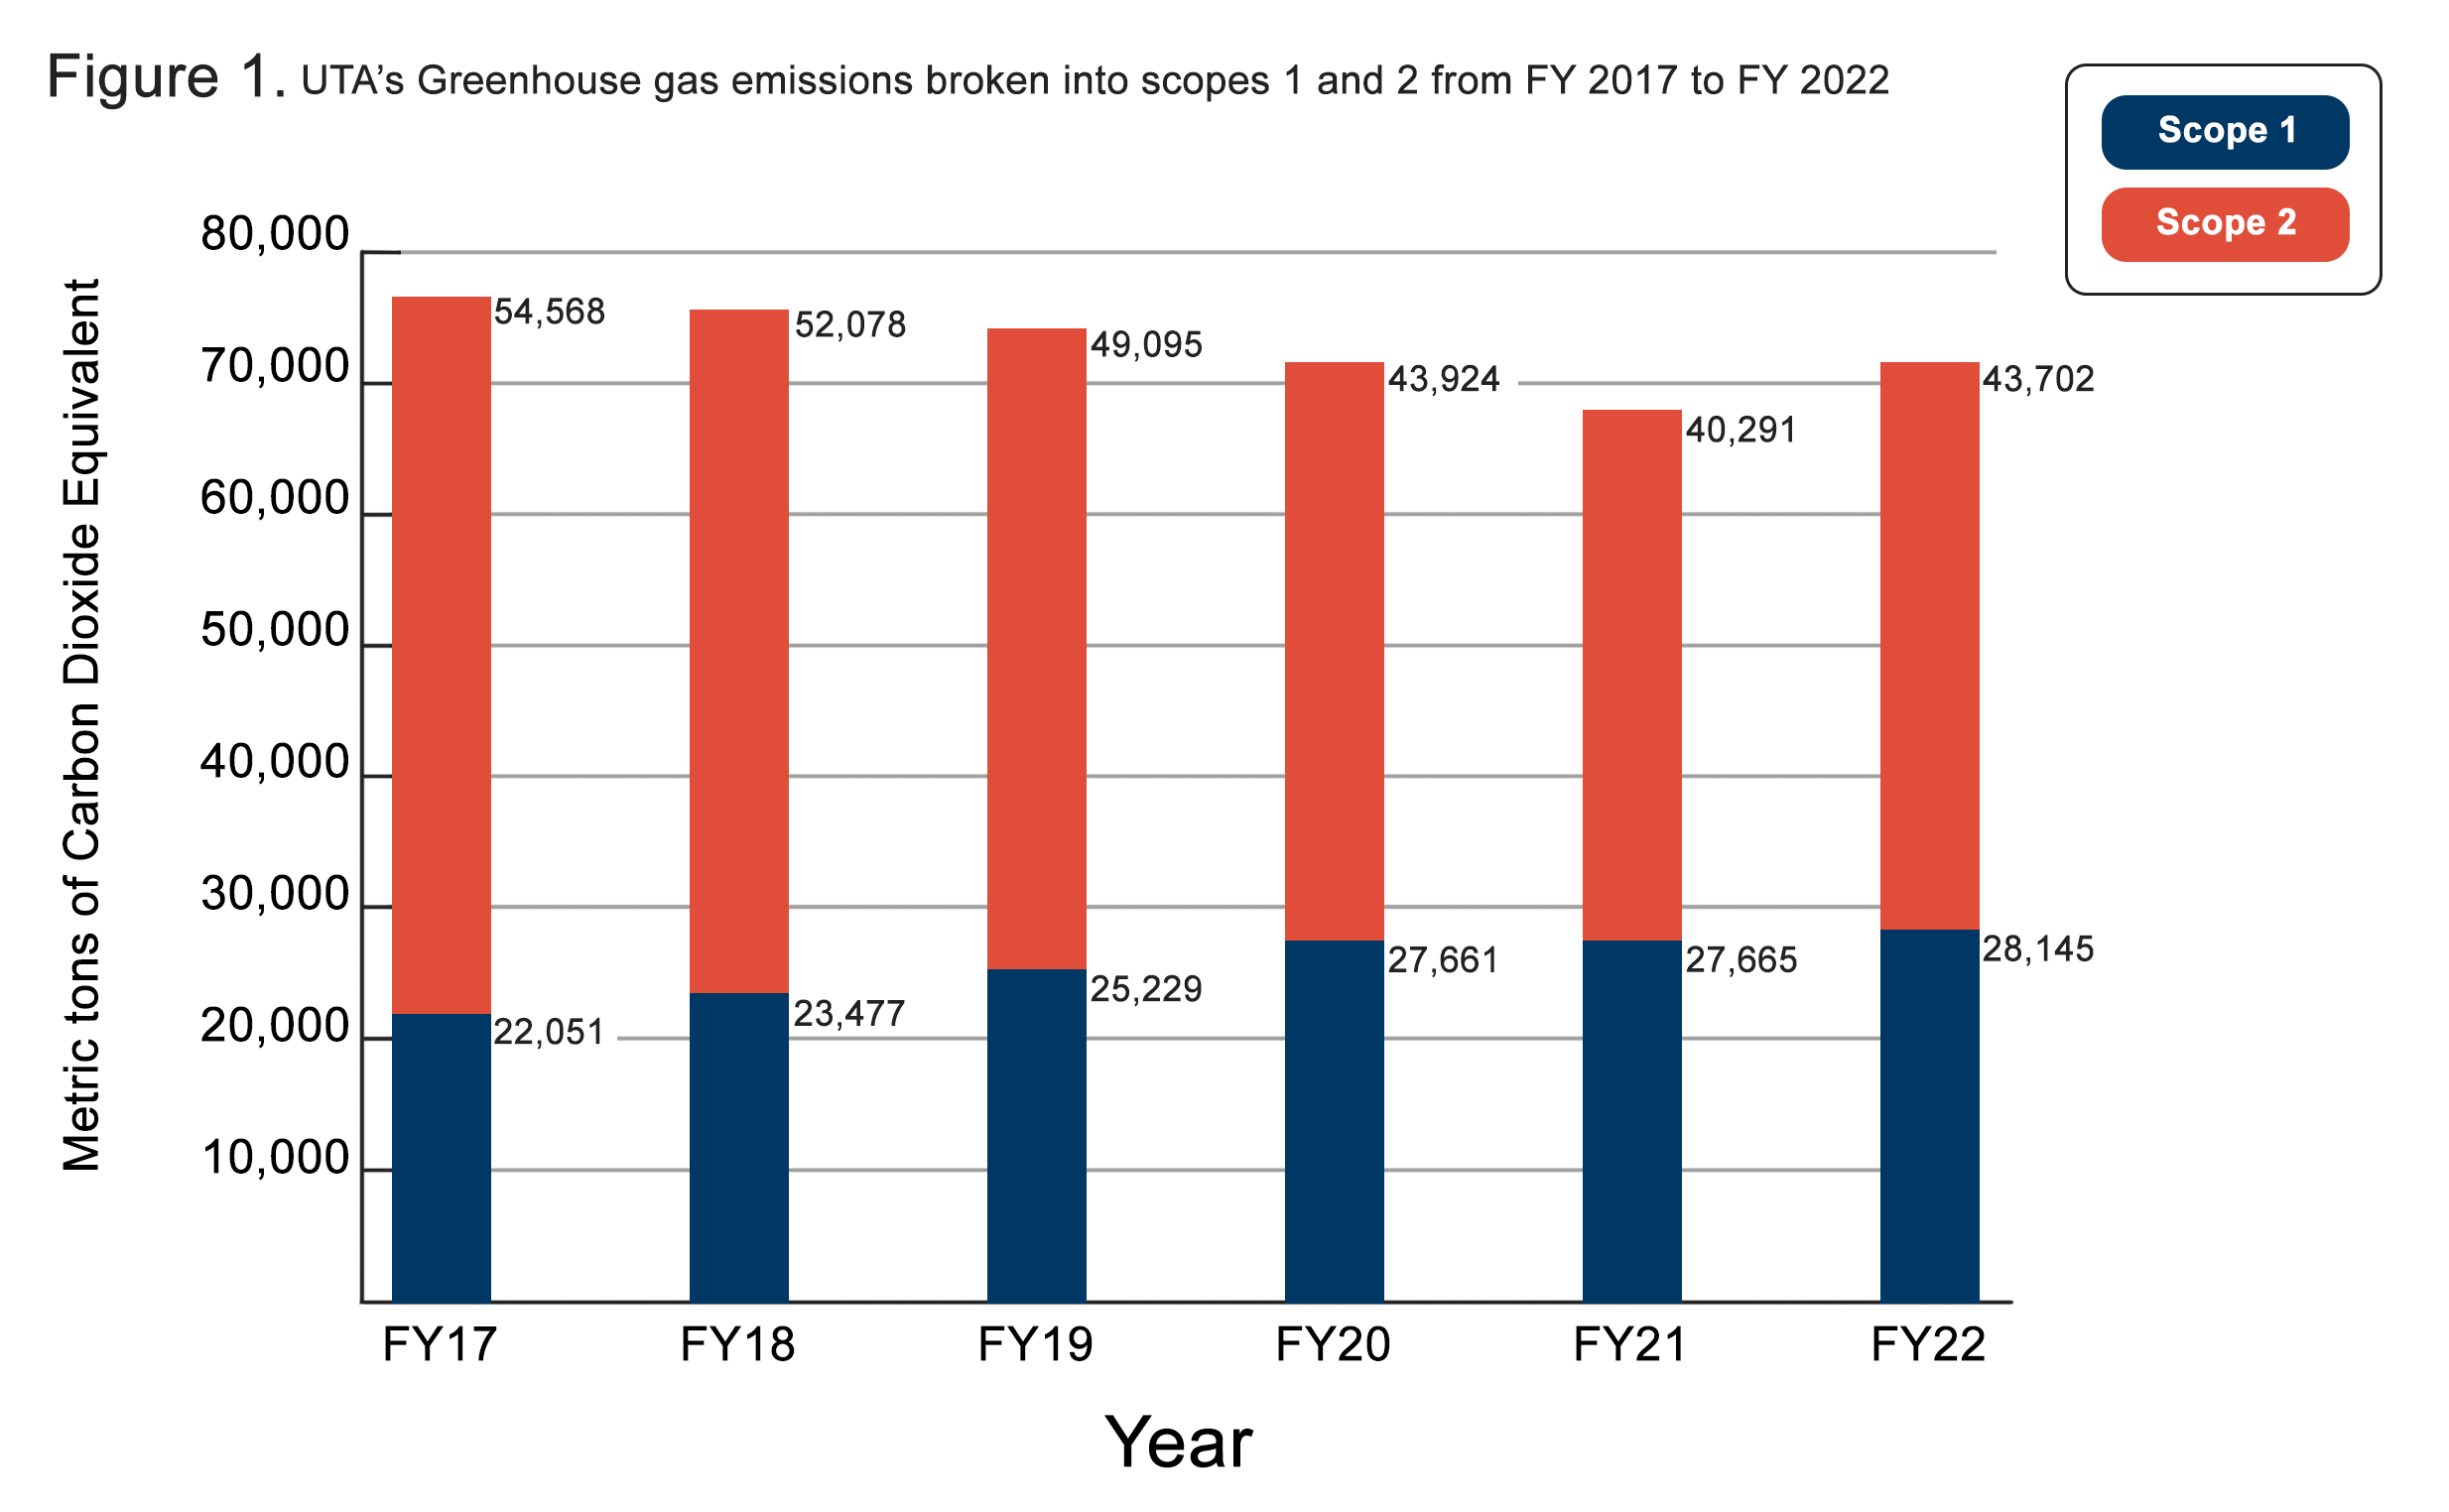
Between FY 2017 and FY 2022, total greenhouse gas emissions at UTA decreased overall (see Fig. 1).
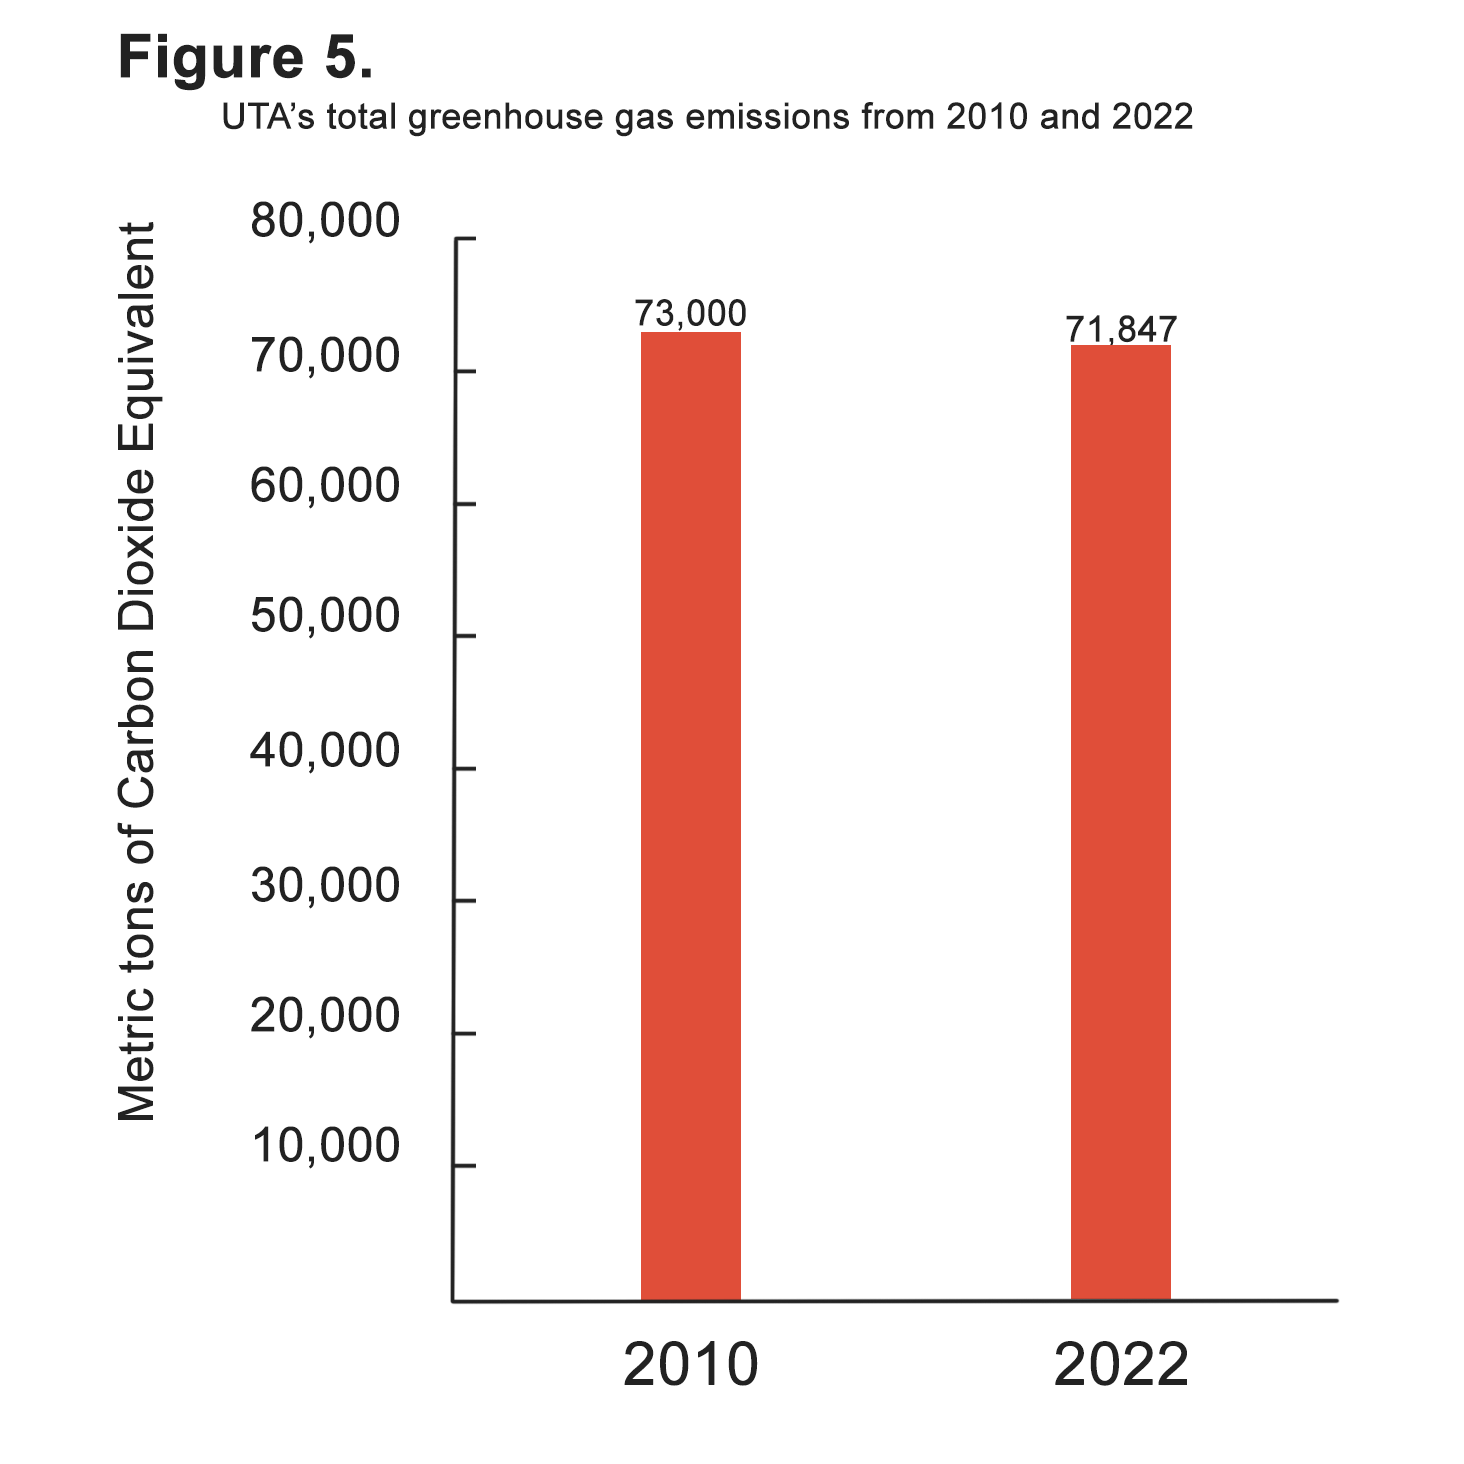
UTA’s campus underwent an expansion in size from 2010 to 2022. Despite this expansion, the greenhouse gas emissions per square foot have been cut by almost a third in this time (see Fig. 4), indicating the success of low emission practices on campus when construction increases are neutralized. When looking at total emissions, without accounting for the larger size of the campus, there is a net decrease from 2010 to 2022 (see Fig. 5). While there was a net increase in total emissions between 2010 and 2019, starting in 2020 emissions dipped below 2010 emissions.

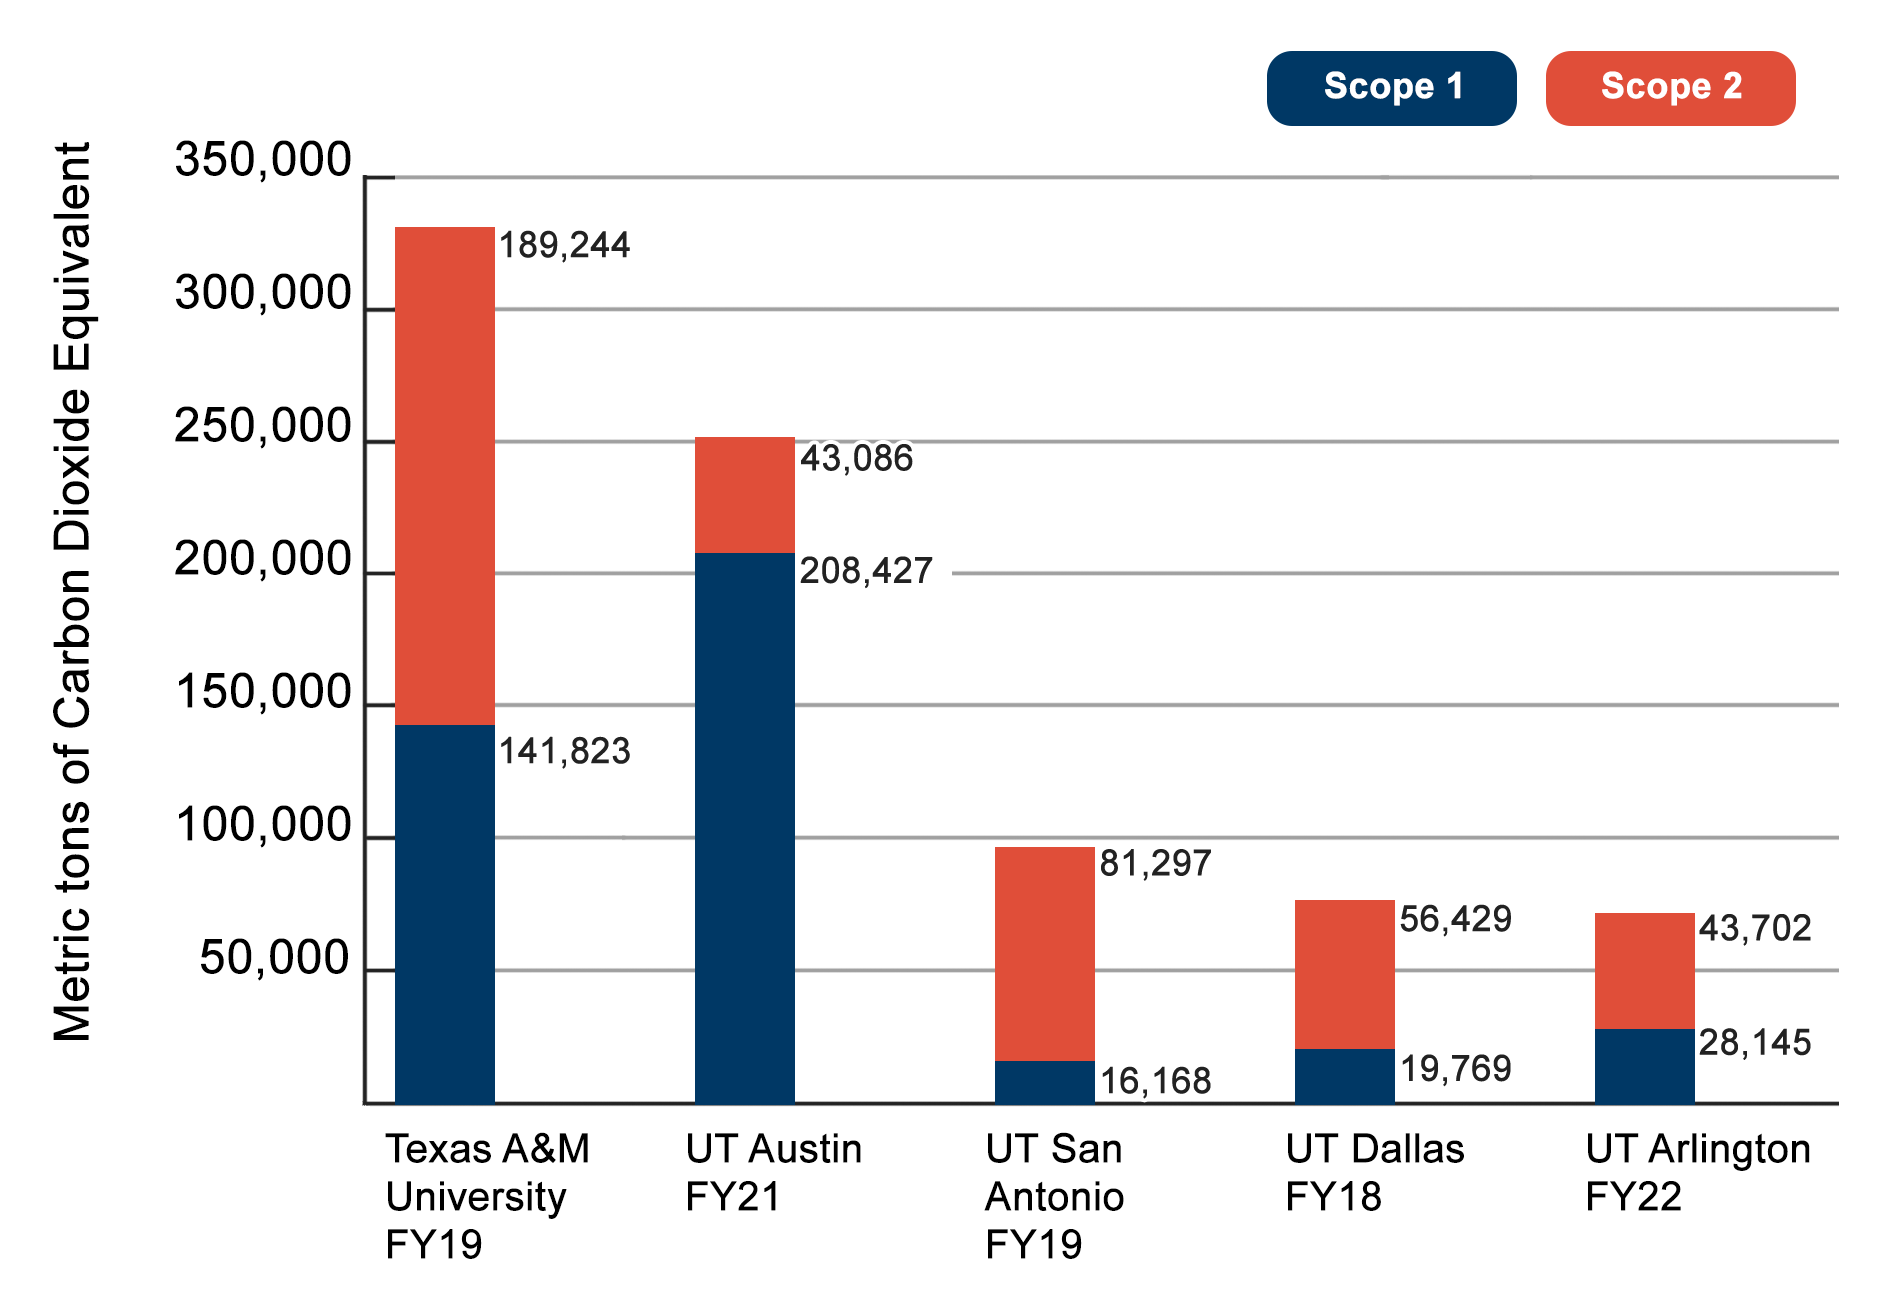
UTA's Greenhouse Gas Emissions Compared to peer institutions, using the performance year as reported in AASHE STARS
EMISSIONS INVENTORY RESULTS FROM 2019
The 2019 inventory was conducted using SIMAP (Sustainability Indicator Management and Analysis Platform), offered by the Sustainability Institute at the University of New Hampshire. SIMAP guides universities in estimating emissions in 3 major areas: direct campus emissions (e.g. due to stationary fuel), indirect campus emissions (due to purchased electricity), and indirect transportation emissions (due primarily to commuting). SIMAP’s emissions factors are taken from US Environmental Protection Agency and other documented sources. Input data for SIMAP was collected from various sources like UTA’s Office of Sustainability, Data Analytics team, Office of Facilities Management, food outlet managers, and students, faculty, and staff.
The major contributors to UTA’s greenhouse gas emissions are shown in Fig. 1. Slightly over half of the emissions (51%) were due to electricity consumption, with indirect transportation emissions (commuting and international travel) contributing the second largest share. UTA’s emissions were 2.0 metric tons of carbon dioxide equivalents (CO2-eq.) per full-time equivalent (FTE) student. UTA emissions decreased from 2017 to 2019, despite increased student enrollment and a 7% increase in building area. Although UTA consumption of electricity increased during this period, emissions from electricity decreased, due to reduced coal generation and increased wind power. In addition, emissions from commuting decreased, due to a 9% increase in on-line enrollment, coupled with a 6% decrease in on-campus enrollment.
| Emissions Source (Metric tons CO2e) | 2005 | 2010 | 2016 | 2017 | 2018 | 2019 |
|---|---|---|---|---|---|---|
| Total Scope 1 Emissions | 25522 | 21092 | 21079 | 18059 | 18706 | 760 |
| Vehicle Fuel Use | 4628 | 1953 | 787 | 844 | 238.05 | 646 |
| Natural Gas Combustion | 17038 | 17922 | 20175 | 16543 | 18706 | 20988 |
| Total Location Based Scope 2 Emissions | 58455 | 54856 | 60032 | 54386 | 51133 | 51800 |
| Electricity Usage | 58455 | 54856 |
60032 |
54386 |
51133 |
51800 |
| Total Emissions | 83978 | 75948 |
81111 |
73289 | 70838 | 73666 |
SUGGESTED STRATEGIES FOR REDUCING GHG EMISSIONS
Several options were explored for reducing emissions from electricity consumption, the major contributor to greenhouse emissions at UTA. It was found that implementation of solar panels on 14 major UTA buildings would reduce emissions due to purchased electricity by 6.3%. The initial investment would pay for itself in savings in 1.7 years. It was found that about 23.9% of UTA’s campus is covered with trees, which absorb 467 tons of carbon dioxide emissions annually. Traditional air pollutants are also removed, providing an estimated $10,000 in benefits. UTA’s trees also provide benefits of almost $9000 per year in terms of avoided stormwater runoff. Planting the 20.7% of UTA’s land currently covered by soil or grass would approximately double the tree benefits at UTA in terms
EMISSIONS INVENTORY RESULTS FROM 2016
In 2012, UT Arlington adopted a series of environmental performance targets as part of the development of a broader Campus Master Plan. Using the 2010 GHG analysis, we developed environmental performance goals in five goal areas: energy, buildings, transportation, waste, and water. Each goal was established with a 2005 base year and a target year of 2020.
By 2020, UT Arlington has committed to reduce:
- Energy consumption by 20%
- Fleet fuel consumption by 20%
- Municipal waste by 20%
- Municipal water use by 20%
In 2016, UTA conducted a Scope 1 and 2 GHG inventory consistent with The GHG Protocol, Corporate Accounting and Reporting Standard. This standard represents the best practice in GHG accounting for corporations, government entities, and universities. The Scope 1 emissions data collected included the quantity of natural gas used in university’s 109 buildings, the quantity of fuel used in university vehicles, and refrigerant purchased by the university, and Scope 2 was from purchased electricity.
| Emissions Source | 2005 | 2010 | 2016 |
|---|---|---|---|
| Total Scope 1 Emissions | 25522.3 | 21092.2 | 21079.5 |
| Vehicle Fuel Use | 4628.6 | 1953.1 | 787.6 |
| Natural Gas Combustion | 17038.2 | 17922.5 | 20175.3 |
| HCFC-22 | 3855.5 | 1216.6 | 116.6 |
| Total Location Based Scope 2 Emissions | 58455.7 | 54856.7 | 60032.2 |
| Electricity Usage | 58455.7 | 54856.7 |
60032.2 |
| Total Emissions | 93978 | 75948.9 |
81111.7 |
In fiscal year 2016, total Scope 1 and 2 emissions for UT Arlington were 81,111.3 metric tons CO2e as shown in the table. This represents a 6.9% increase in emissions compared with 2010 and a 3.5% decrease in total Scope 1 and 2 emissions compared with 2005. The main drivers in the emissions increase was a 12.5% increase in natural gas consumption and an approximately 15% increase in electricity consumption on the campus. The increase in GHG emissions associated with the increased electricity usage was lessoned due to changes in electricity emissions factors used in the analysis to reflect an overall cleaner electric grid. At the same time, UT Arlington reduced emissions from both refrigerant usage and its vehicle fleet between 2010 and 2016, as HCFC – 22 emissions decreased by 90% and vehicle fleet emissions decreased by roughly 60%.
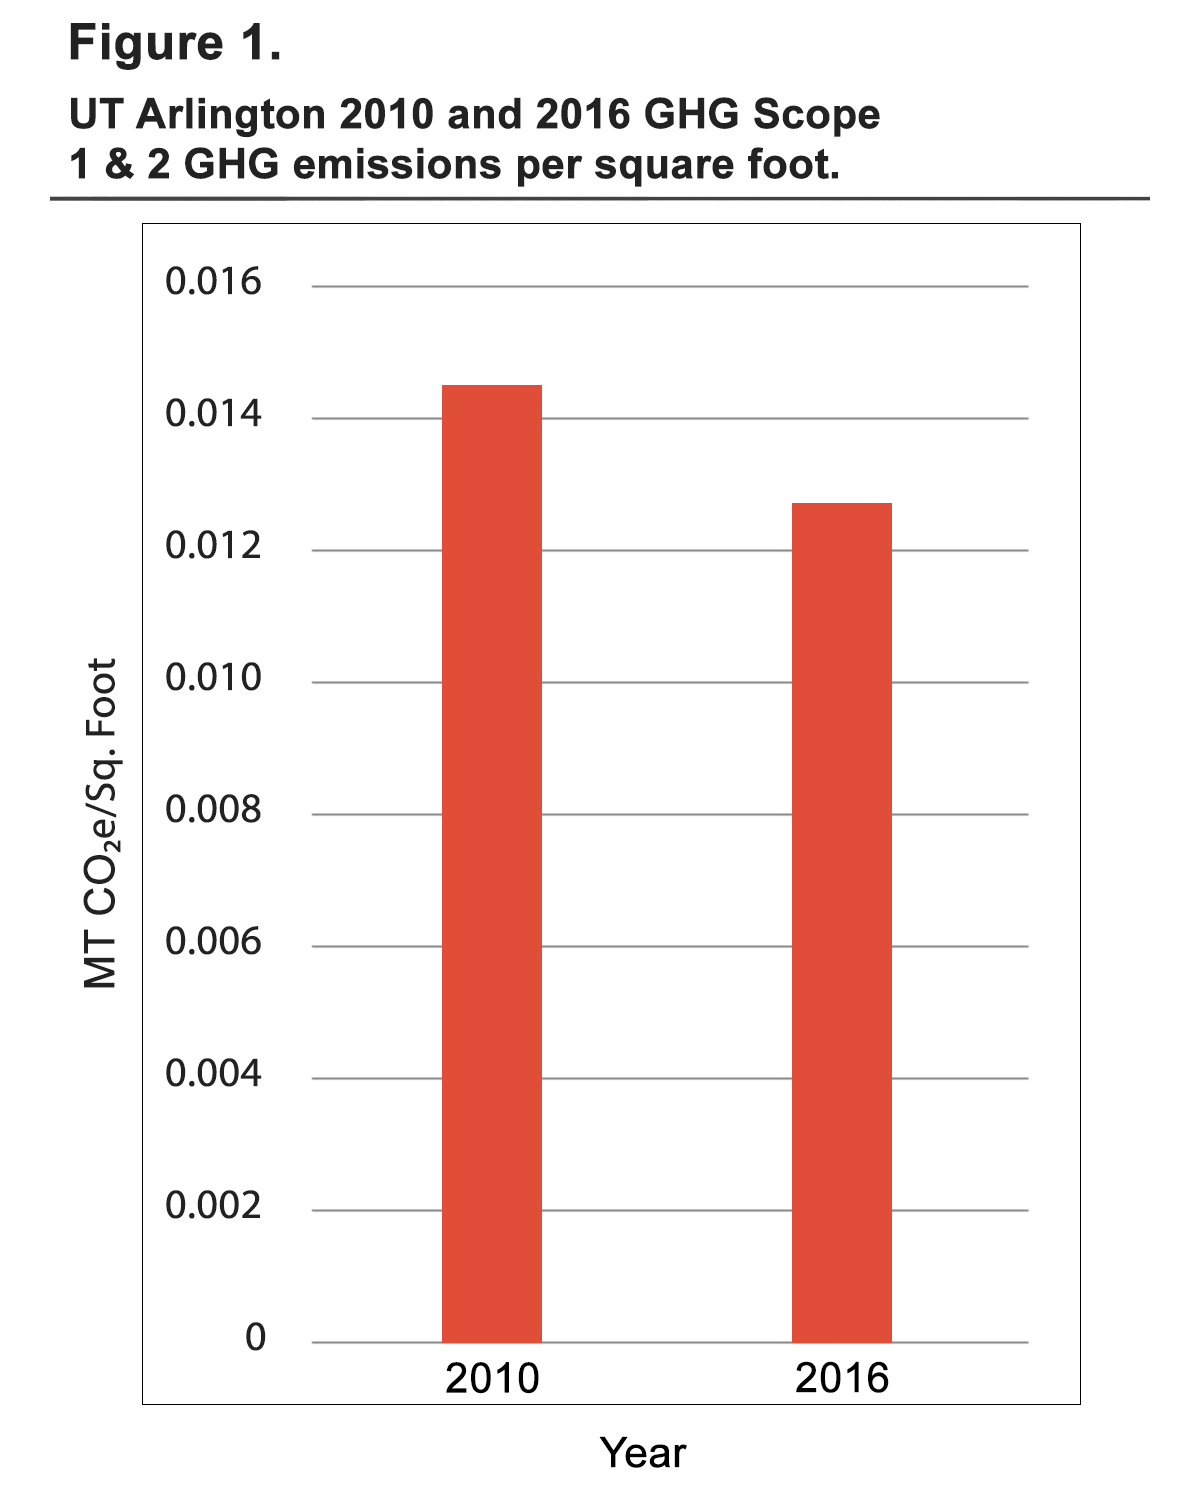
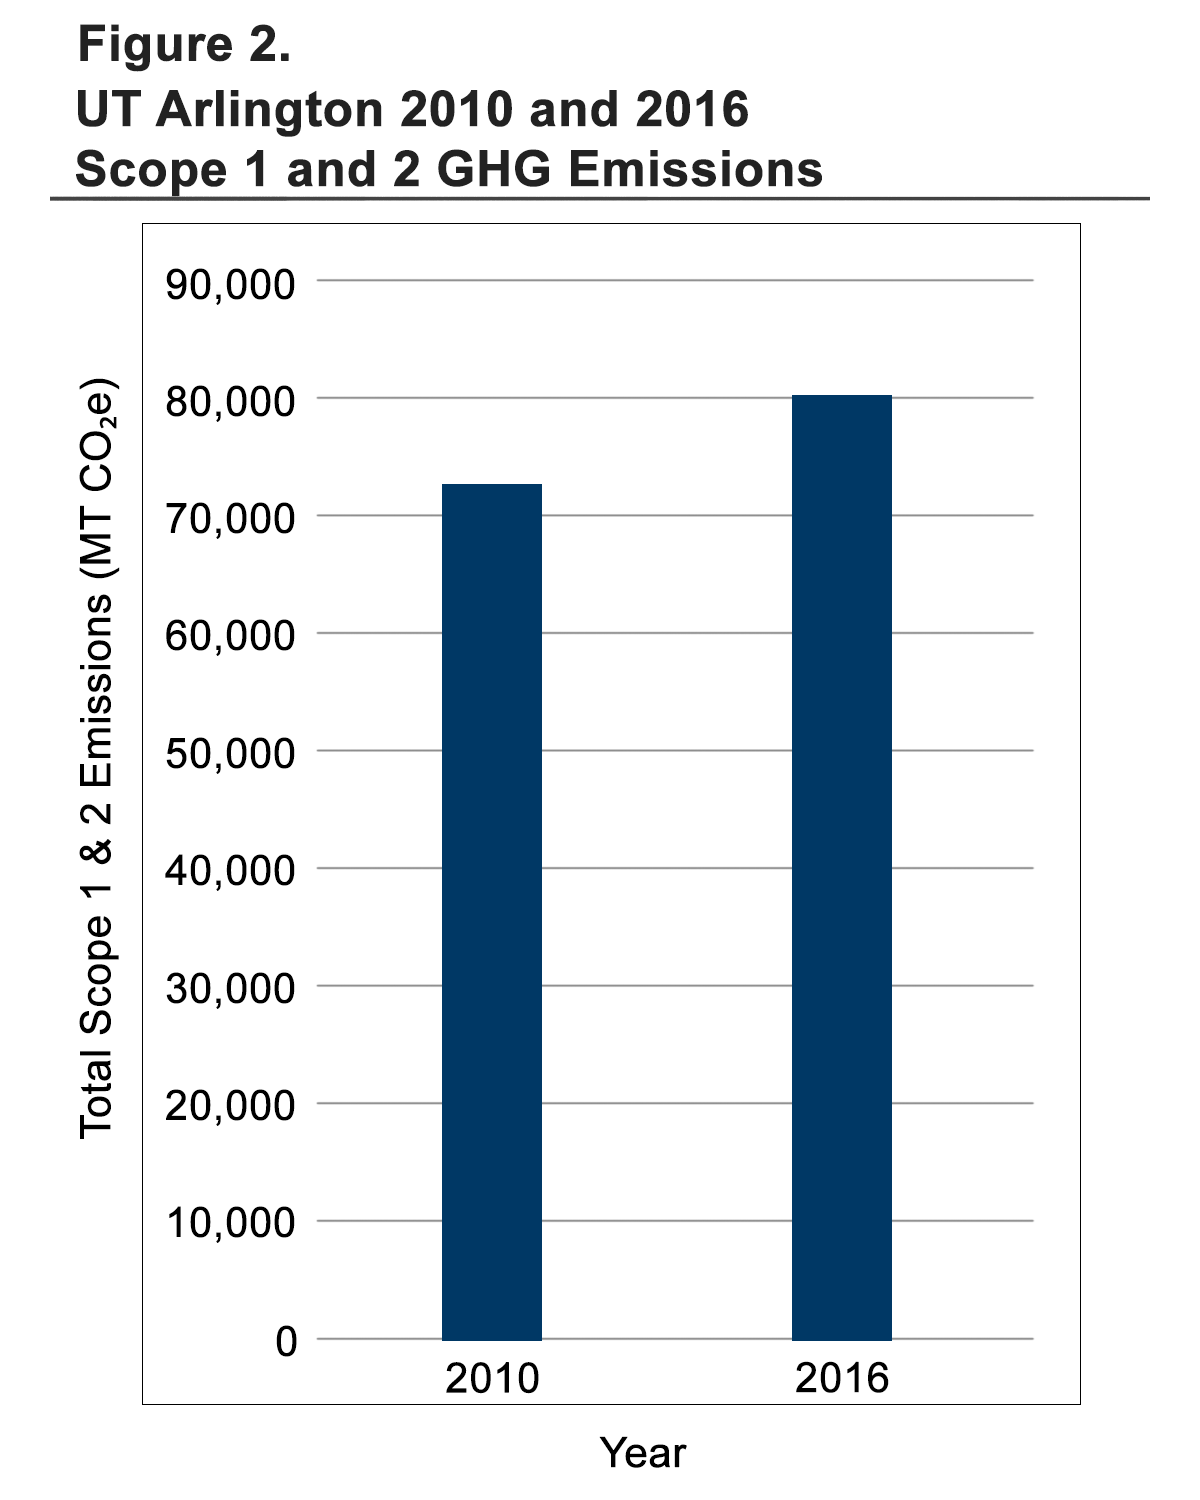
Scope 1 and 2 emissions increased by approximately 7% between 2010 and 2016 despite an approximately 20% increase in the square footage of buildings on campus during the same time period (Figure 2). As the vast majority of UT Arlington’s emissions are produced by electricity and natural gas consumed in building, square footage is likely the major driver of emissions at the university. Given the large increase in building square footage between 2010 and 2016, facility emissions from natural gas and electricity per building square foot decreased by 12% between 2010 and 2016, as shown in Figure 1.