634 Nedderman Hall
Box 19019
416 Yates Street
Arlington, TX 76019-0019
College of Engineering Student, Faculty and Staff Demographics
Demographic information about faculty, students and staff in UTA's College of Engineering
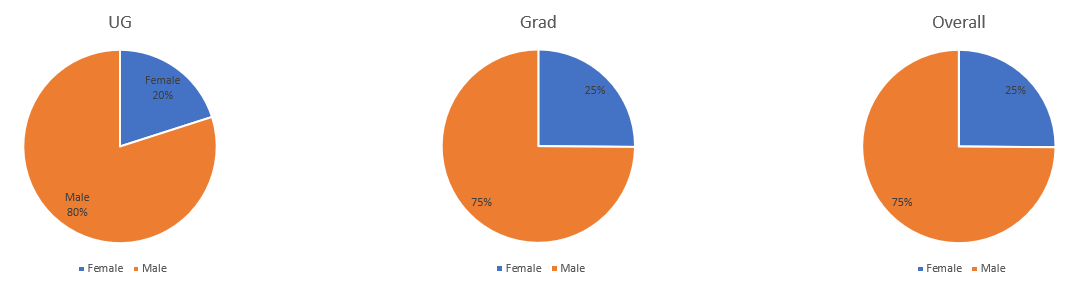
Student Population by Gender
75% of UTA Engineering Students are Male, and 25% of UTA Engineering Students are Female
Ethnic and Regional Diversity
UTA was recently ranked as the fifth-most diverse university in the United States, and that diversity is reflected in the College of Engineering's enrollment.
Ethnic
- 32% International
- 23% White
- 22% Hispanic
- 13% Asian
- 7% Black
- 3% Multicultural
- <1% Native American
- <1% Pacific Islander
- <1% Unknown
Regional
Students from 74 countries were enrolled in the College of Engineering in the fall of 2020. Students represent:
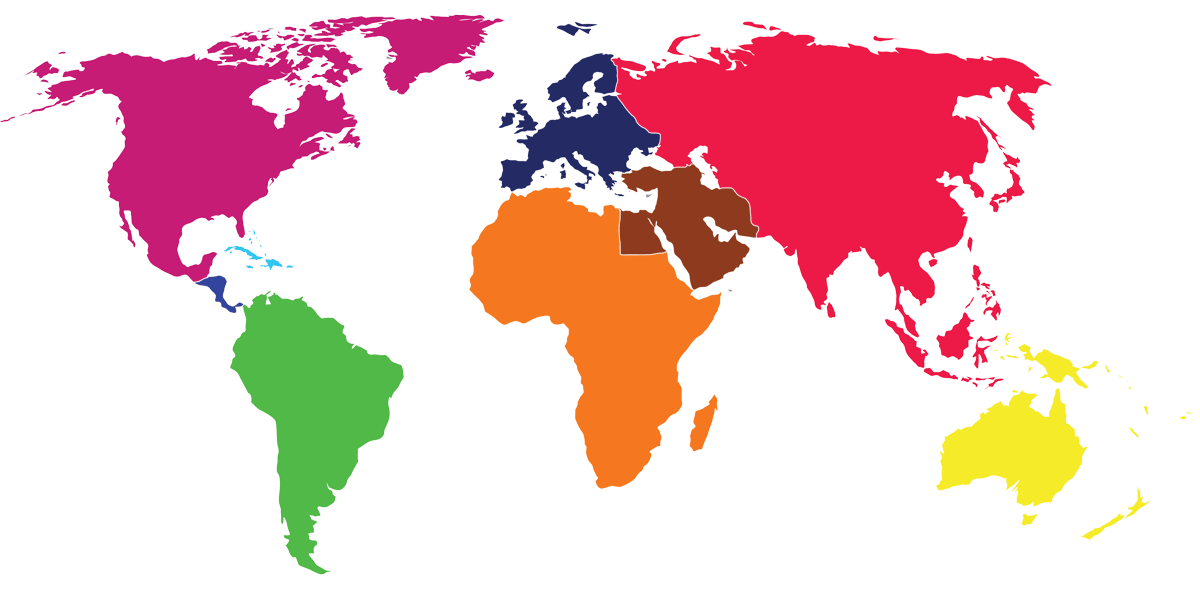
- 20 countries in Africa
- 15 countries in Europe
- 14 countries in Asia
- 11 countries in the Middle East
- 4 countries in South America
- 4 countries in Central America
- 3 countries in North America
- 2 countries in the Caribbean
- 1 country in Australia/Oceania
Faculty Makeup
| Race/Ethnicity | Professor | Associate | Assistant | NTT & Other |
|---|---|---|---|---|
| Asian | 39 | 22 | 26 | 14 |
| Black/African-American | 2 | 1 | 1 | 1 |
| Hispanic | 1 | 0 | 1 | 3 |
| Multiple | 0 | 0 | 1 | 0 |
| Unknown/Not Reported | 2 | 0 | 5 | 5 |
| White | 46 | 12 | 12 | 28 |
| Total | 90 | 35 | 46 | 51 |
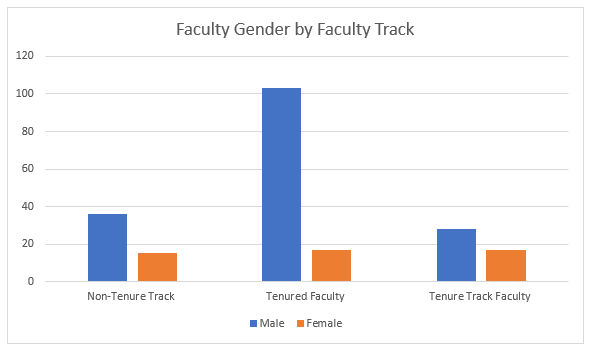
Faculty Gender by Track
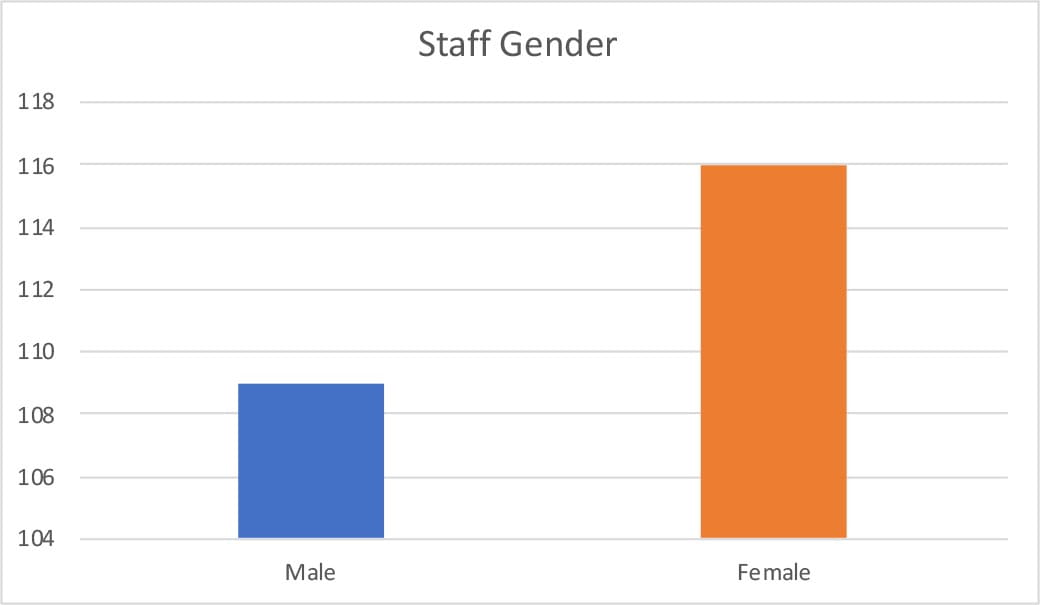
Staff Makeup
| Race/Ethnicity | Number |
|---|---|
| Asian | 50 |
| Black/African-American | 23 |
| Hispanic | 10 |
| Multiple | 1 |
| Unknown/Not Reported | 17 |
| White | 124 |
| Total | 225 |